Free System Center Operations Manager (SCOM 2012 R2 and SCOM 2016) Performance Monitoring Management Pack
Read More...
Prior to upcoming upgrades or a new installation of System Center Operations Manager (SCOM), it’s important to keep statistics on how the performance of your environment is impacted over time. It can also be the case that you want to make changes to the infrastructure and you’d want to understand if you get a positive or negative impact.
For this purpose, Approved has developed a free Management Pack for SCOM 2012 R2 and SCOM 2016 that simulates a number of user calls using PowerShell commands – as they communicate with SCOM in a similar way as the console through SDK.
PowerShell may not entirely be the right solution for simulations of the console, but at least it gives us an anchor point as to whether performance improves or deteriorates over time.
This also gives you, as a platform administrator, an opportunity to compare your values to other environments, in order to get an idea if your environment is working well or is suffering from performance issues.
The Management Pack consists of four different types of rules that run at different intervals, against two different classes for data collection. All rules are disabled on the import, so selected rules need to be activated after the fact.
Internally at Approved, we use the Management Pack in all our projects to compare the current performance with previous versions of SCOM, but we primarily use it to ensure the quality of the projects we work in, as we continually add more agents or management packs.
In the Management Pack, you’ll find two different views under the “Operations Manager Performance” folder after the management package has been imported into SCOM.
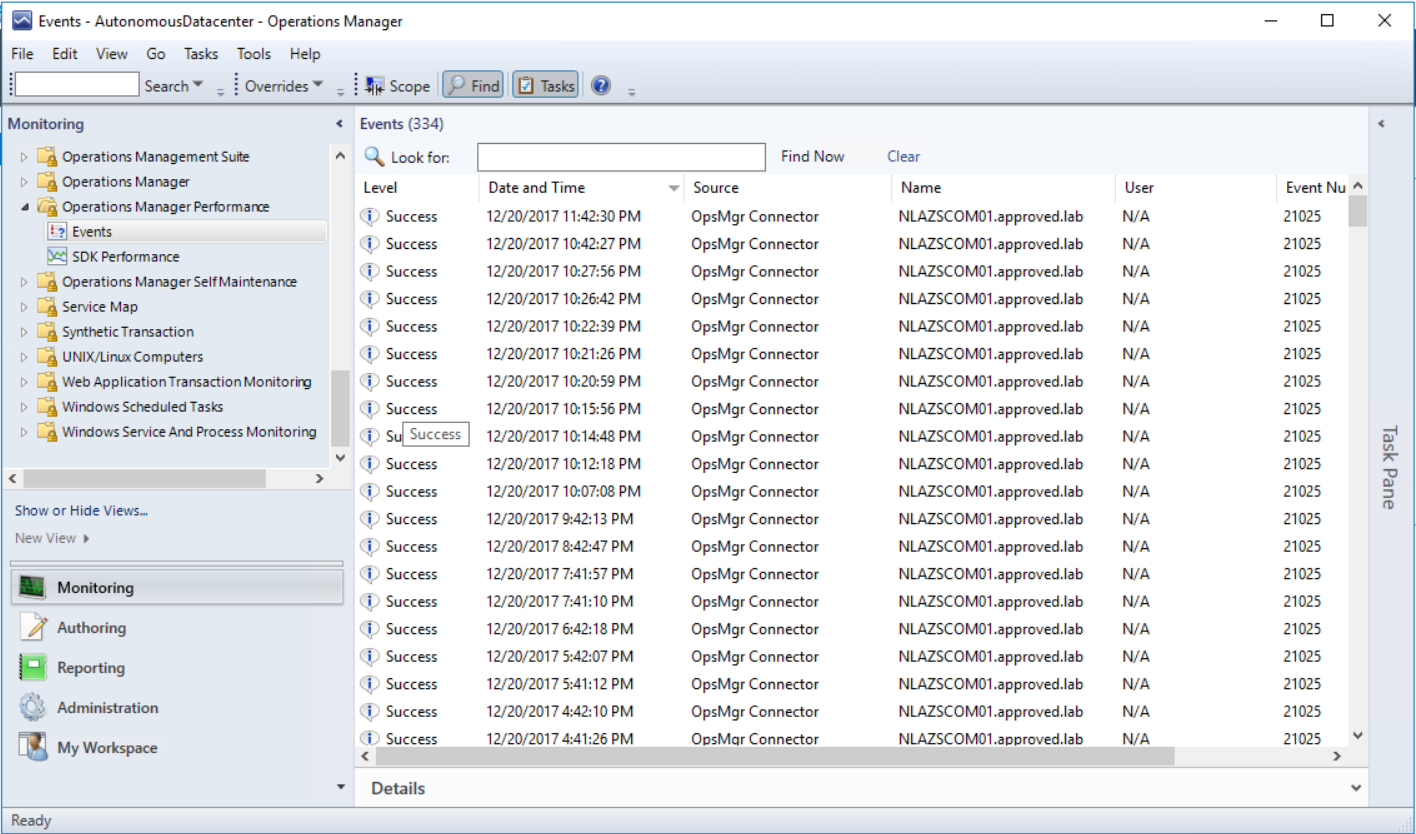
The rule that collects Event ID 21025 from the Operations Manager log is used to identify if there are abnormal changes in the environment that force SCOM to process new configuration files. The rule is called “OpsMgr Connector Event New Config Rule” and has “Root Management Server Emulator” as a target.

In earlier environments, a phenomenon called “Config Churns” could be encountered, and it was a major problem when you only had a “Root Management Server” that handled this kind of calculations. In later versions of SCOM, this load can be divided by several servers, but you do not want to change your environment too much, especially during daytime when you have operators who may work in the console.
More information about this can be found here.
We analyze the trends of this event with the help of our IT Service Analytics tool. This gives us a whole new dimension to work with this kind of data and to help us identify patterns such as time of day or weekdays.

To get a good picture of how performance is affected over time, we have three different rules available.
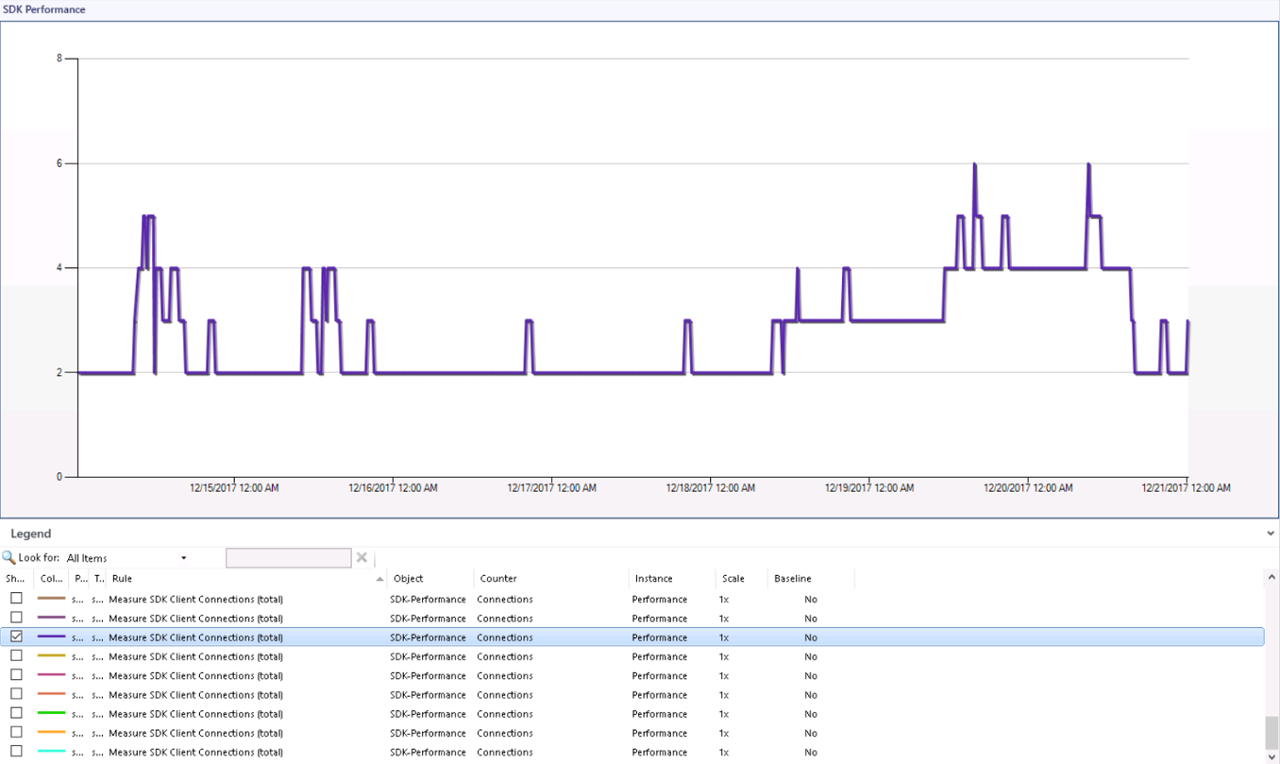
Measure SDK Client Connections (total). Collection of a number of console connections on each management server. This differs from the built-in as it counts the total number of processes that are connected in one single rule. This rule has “Management Server” as a target and runs as a default every 15 minutes.
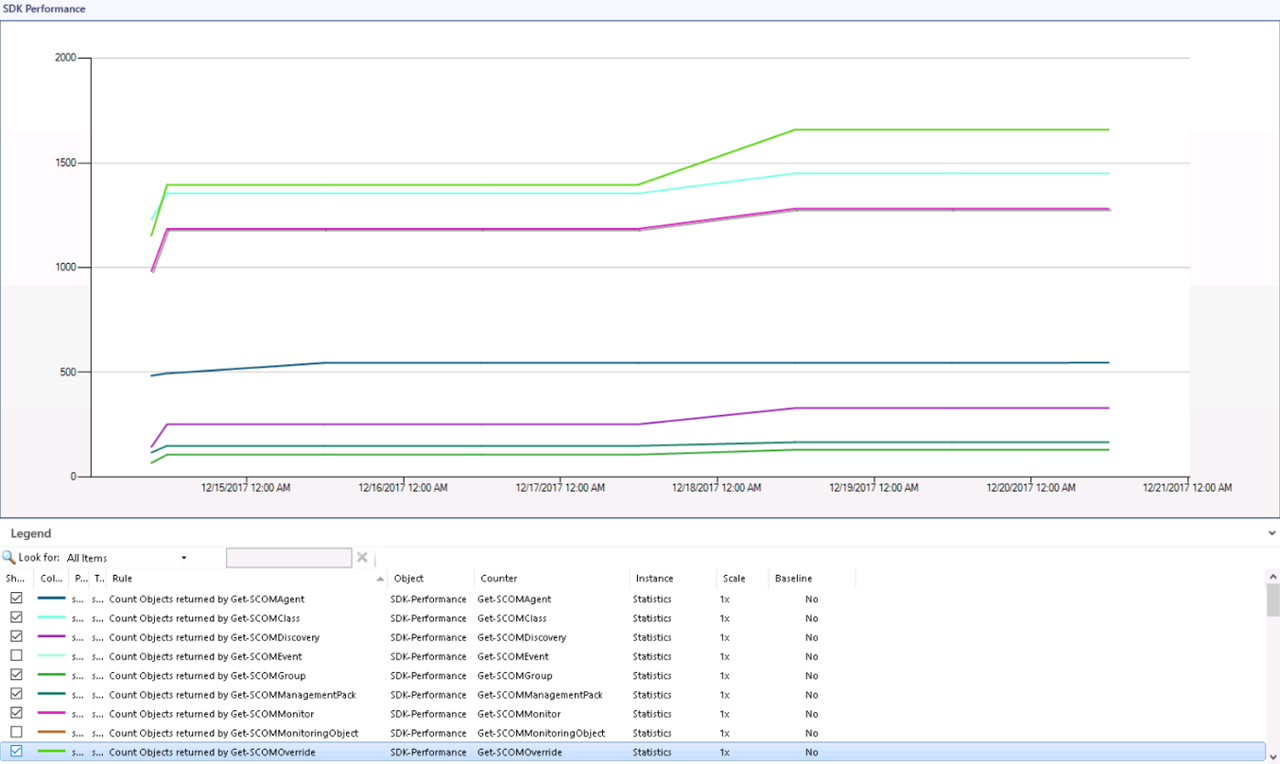
Count objects returned by Get- (command). Collection of a number of items returned on each execution. As an example, Get-SCOMAgent returns the number of agents installed in the environment and stores the result in each operations manager database. This rule has the “Root Management Server” as a target and runs as a default once a day.
Measure Get- (Command) Execution Time (s). Measures the time it takes for the script to run and returns this value in seconds. This rule has “Management Server” as a target and runs as a default every 15 minutes.
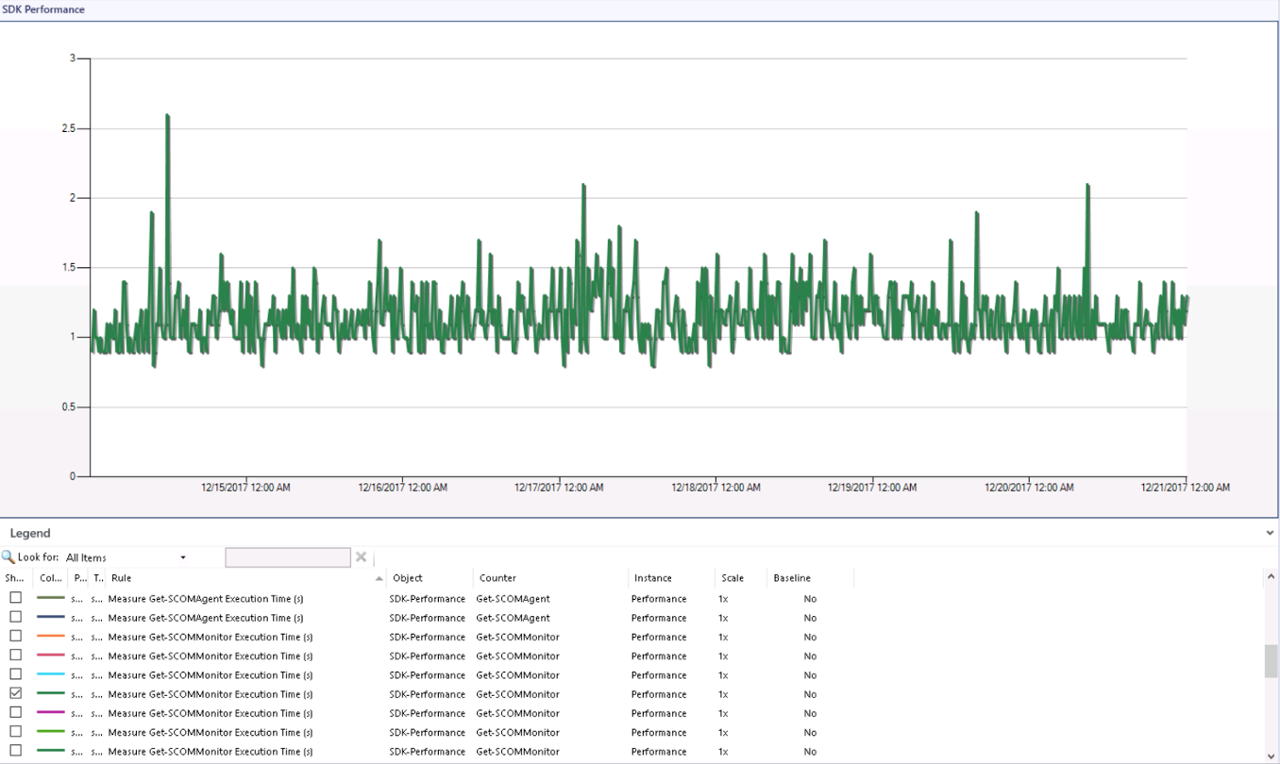
The above values can be compared in retrospect to see if changes made in the environment get a percentage improvement or deterioration and you can also see if it is due to too many console users against a specific server or too many changes that might occur in the environment.
The PowerShell commands, which are currently in use, are as follows:
Please be careful before activating the rules and be sure that they do not affect your environment negatively. If you have not trimmed it well and, for example, collect a lot of events, the Get-SCOMEvents rule can result in long response times that may adversely affect performance. All scripts have a 120-minute timeout, which can be noticed in the error logs when changes occur in the environment that prevent the script from being executed. This is unfortunately quite normal and this is how SCOM works.
To provide a good overview of performance, we can easily run a performance report through IT Service Analytics that shows an overview of the collected data.
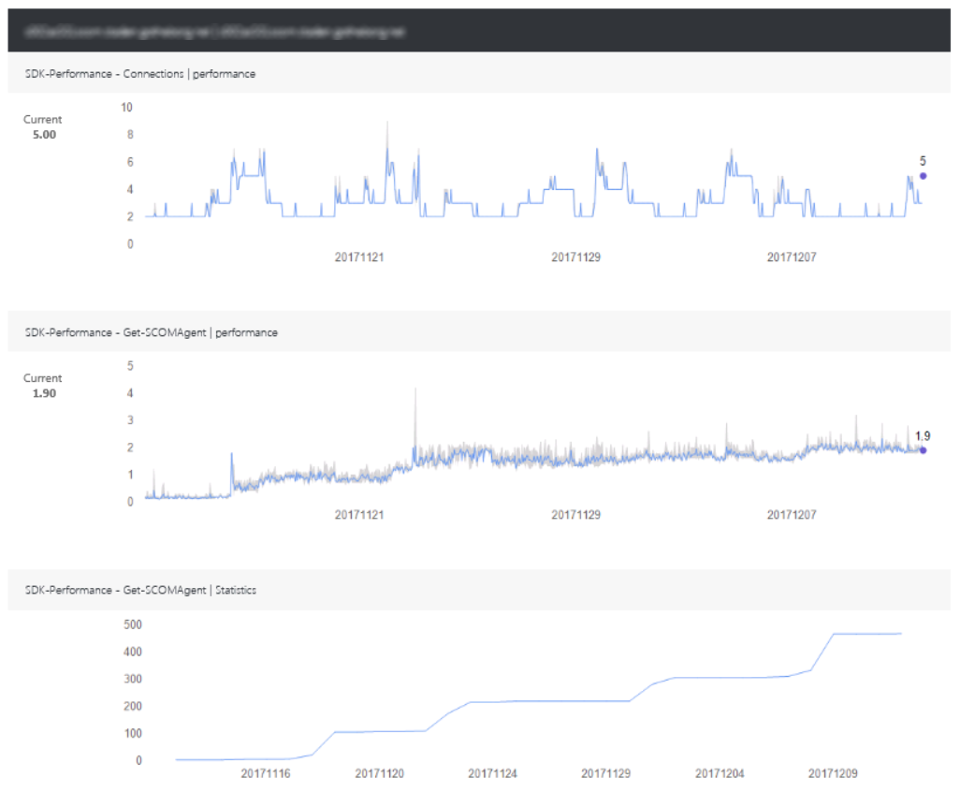
To have a more detailed view of specific dates, click on the desired day to see more details on selected counters +/- 1 day.

| Management Pack | Version |
|---|---|
| Approved.System.Center.Operations.Manager.2012.R2.Performance.Monitoring | 1.0.0.46 |